
For today’s portion of my review of 2018, it’s one of my personal highlights every year: the statistics!
For any newcomers among you, this is where I take the 261 films I watched for the first time in 2018 and analyse them in all kinds of different ways, and compare them to previous years too. It’s exciting, I promise. (Well, it is to me.)
As a bit of a P.S. before we begin (yes, I know that doesn’t make sense), I’m now a “pro” member of Letterboxd, which means I get stats there too. They’re somewhat different to these because they also include my rewatches, a few TV bits and bobs, and things like that. They do include categories I’ve never bothered to tabulate though, like repeated actors and various crew positions and so on, so there’s that. Anyway, if you’re interested, you can check those out here.
And now, without any further ado…
![]()
As I previously mentioned, I watched 261 new feature films in 2018. That blows away all previous years, becoming my highest final total by 30.5% over the previous best, 2015’s 200.
Included in that is the one extended or altered cut of a feature I’d seen before that I watched this year. The film in question was Terminator 2, which I counted as part of the main list because it was (a) in 3D, and (b) the original theatrical cut, which I’d never seen before.
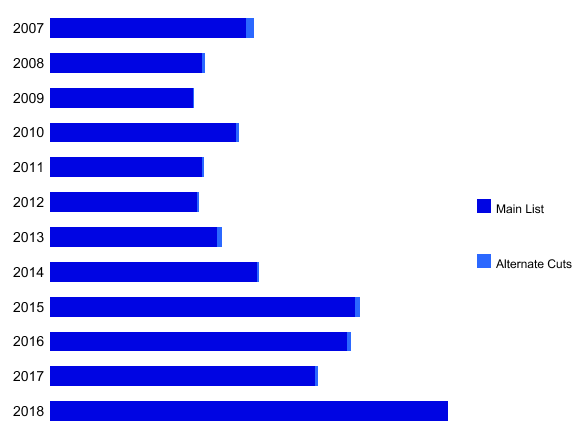
Those 261 films aren’t the whole story, however, as in 2018 I continued my Rewatchathon, in which I aimed to rewatch 50 films I’d seen before. I hit that goal exactly, meaning my total feature film viewing for last year was 311 films. That’s a 36.4% increase on the previous best, 2017’s 228.
I also watched eight short films in 2018, which is a small number but is also the most shorts I’ve watched in a single year since 2007. They won’t be included in the following statistics… except for the one that says they are.
The total running time of those 261 films was 461 hours and 9 minutes. That’s a little over 19 solid days! It’s way beyond the previous high, 2015’s 370 hours (aka 15½ days), though not as much of an increase as that was at the time: 2015 beat 2014 by 133 hours, while 2018 beats 2015 by ‘just’ 91¼ hours. Finally, add in the those eights shorts and the total running time of my new 2018 viewing was 462 hours and 48 minutes. (Maybe next year I’ll start counting my Rewatchathon here too…)

Next up, a graph I’ve never done before. I thought of it in a sudden flash of inspiration in early December, at which point it felt glaringly why-have-I-never-thought-of-this-before obvious. It’s my viewing mapped out across the year, month by month. It would be interesting to do this for every previous year, to see if the shape remains roughly the same or not. (I could do that, but it would be a lot of data to re-examine. Knowing me, I’ll wind up doing it someday.) One particularly noteworthy thing on this year’s chart: April and May are my two highest months ever.

Now, the ways in which I watched all those films. For the fourth year in a row, the year’s most prolific viewing format was streaming. It accounted for 109 films, which sounds like a big increase from last year’s 76, but because I watched so many films this year its percentage actually fell, from 2017’s 43.2% to 41.8% in 2018. That’s well down on 2016’s 57% as well, which pleases me because I own an awful lot of discs that I ought to be watching instead.

To break the above down further, my streaming service of choice was actually Amazon (same as last year, in fact), with 37 films (33.9% of streams). Netflix was close behind on 35 (32.1%), though if I included TV series it’d be far in front. A little way behind was Now TV with 25 (22.9%) — not bad considering I only subscribe for a month or two in order to watch the Oscars. Well, I like to get value for money. Finally, there was Rakuten with nine (8.3%), all of which were individual rentals rather than through a subscription. That was mainly thanks to my parents having some vouchers that needed using up, but also a couple of UHD rentals — it’s so much easier to find 4K films on Rakuten than on Amazon, in my experience.
The format in second place was Blu-ray. Every year I write in this stats post that I need to watch more of the stuff I buy on disc, but this year I finally made good(-ish) on that desire: I watched 82 films on Blu-ray (31.4%), a 78% increase on the average of the last four years. That’s a solid improvement, but I could still do better.

It’s a big drop to third place, where we find a tie between TV and downloads, each with 25 films (9.6%). That represents an increase in percentage for both of them from last year, so my reduction in streaming didn’t go entirely to Blu-ray. Oh well. The graph below is for TV, because it was once so mighty in my viewing, but it’s worth noting this is the highest year for downloads ever. Not sure why — I don’t feel like I download that many films.

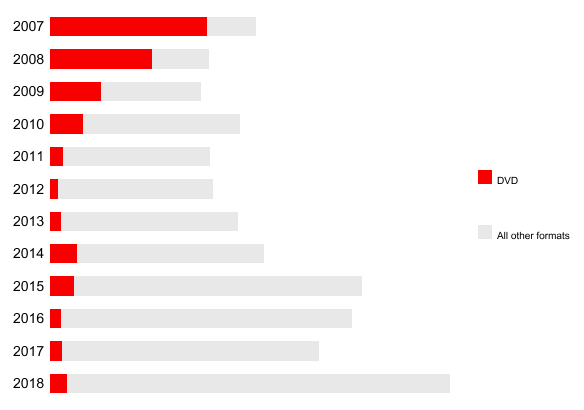
In fifth place we find the once-dominant DVD, reduced to a lowly 12 films (4.6%). That’s an increase from last year’s eight, though the percentage is more or less the same (it was 4.8% last year). I’ve got hundreds of the things that I purchased in the format’s heyday but never got round to watching, which nowadays are sometimes trumped by availability elsewhere. I don’t even mean paying to upgrade to a Blu-ray — why watch something in SD on DVD when I could stream it in HD on Netflix or Amazon Prime?
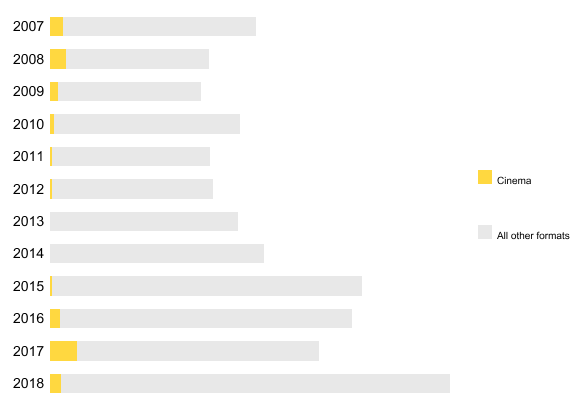
With such a high overall total, it’s no surprise that almost every format saw an increase this year. The only exception was cinema, which stormed up to third place in 2017, but now returns to bringing up the rear, as it has since 2013. I made just nine trips this year (eight for new films, plus I saw Mission: Impossible – Fallout a second time), exactly half of last year’s 18. Will it go back up again in 2019? That depends what the big screen offerings are like, I guess.
In amongst all that, I watched 18 films in 3D (6.9%), up from 11 last year, and 14 in 4K UHD, a massive increase on last year’s one! Goodness knows what direction those numbers will go in future. I still buy 3D Blu-rays, but there are an increasing number of forthcoming titles that were released in 3D theatrically but don’t have a 3D Blu-ray scheduled. It feels like the format may be tailing off now, sadly. As for UHD, Netflix continue to favour it for their series, but only sporadically for their movies — a number of their recent high-profile acquisitions are actually only 1080p, like Mowgli and The Ballad of Buster Scruggs. But I did get a UHD Blu-ray player for Christmas (though I’ve not had a chance to set it up yet), so we’ll see how that affects things.
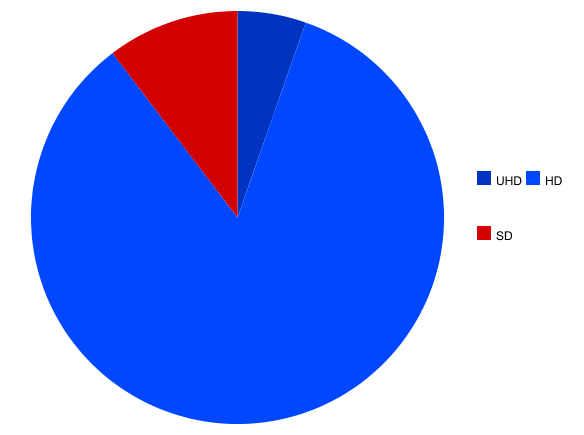
That brings me to the HD vs. SD comparison — or UHD vs. HD vs. SD, as it is now. HD includes virtually all my Blu-ray viewing (I actually watched one film that was in SD but included on a Blu-ray disc), the vast majority of my streamed movies, most of my downloads, 60% of my TV viewing, and all my cinema trips. For UHD, it’s mostly streaming, but with three downloads too. Meanwhile, in the SD camp there’s DVDs, the other 40% of my TV viewing, a handful of streams, one download, and that one Blu-ray. The final result is 220 films in HD (84.3%). Topped up by the aforementioned 5.4% in UHD, that’s 89.6% in HD formats. It’s up over 1% on last year for the highest it’s been since I started keeping track in 2015. It’d be nice to leave SD behind entirely, but, like I said, I still have so many unwatched DVDs…
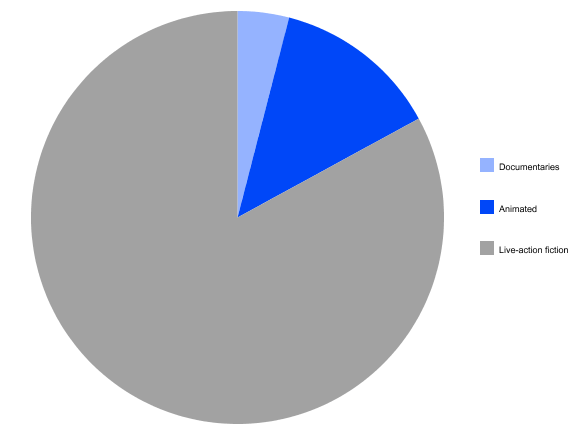
Talking of formats, back in 2015’s stats I tallied up how many documentaries and animated films I’d watched (as opposed to “live-action fiction”, which unquestionably makes up the bulk of my film watching), because I felt like I’d watched a lot of documentaries that year. I’ve continued doing this count each year since, but never mentioned it again because there was nothing noteworthy to say. This year, however, it seemed like I was watching quite a lot of animation, so I’ve revived it to see just how many. Well, the total was 34 animated movies. In terms of sheer volume, that’s over double the average of the last three years. As a percentage, it’s 13% of 2018’s viewing, vs. an average of 8.1% over the previous three years. So, yes, I did watch more animated movies than usual this year. (And while I’m here: documentaries were well up on the last two years too, though not quite as numerous as in 2015.)
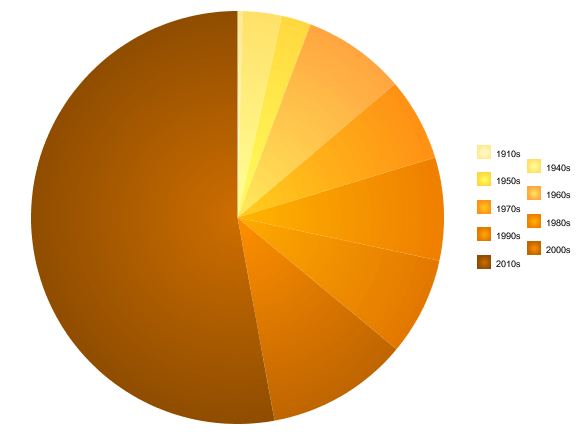
Turning to the age of my viewing now, and the most popular decade was the 2010s (as it has been every year since 2012) with 138 films. It’s a high number, but in percentage terms it actually represents a significant drop: it works out as 52.9%, and you have to go back to 2014 to find a time it was lower. In other words: I watched a greater number of older films. Good good.
So, which decades benefited the most? Well, several of them saw increases from last year, with more achieving double-figure tallies than ever before, but the ’60s and ’80s fared particularly well. In second place, however, was the 2000s, though with just 29 films it was a distant second indeed; and at 11.1%, it’s actually a slight percentage decrease from last year’s 11.9%. The same is true for the decade in fifth place, the ’90s: it increased its number (from 15 to 20), but the percentage went down (from 8.5% to 7.7%).
In between those we have joint third, where there’s the aforementioned ’60s and ’80s, each on 21 (8%). In sixth place is the last decade to make double figures, the ’70s with 17 (6.5%). Rounding things out, the ’40s had eight (3.1%) and the ’50s had six (2.3%); then, after nothing for the ’30s or ’20s, the 1910s had one (0.4%).
In terms of languages, English was as dominant as ever, with 229 films wholly or significantly in my mother tongue; but at 87.7%, that’s easily the lowest percentage it’s ever been. Still, nothing else comes close, though for the second year in a row Japanese was second, in 23 films (8.8%). The only other language to manage double figures was French with 11 (4.2%). In total, there were 27 languages, plus one silent film. American Sign Language once again put in more than one appearance, and British Sign Language appeared in a short film too. Other more uncommon (for me) ones included relatively strong showings by Korean (six) and Hindi (four), and single credits for languages like Hebrew, Urdu, Xhosa, and Yiddish. Also, two films with some Klingon.
As for countries of production, the USA once again dominated with 189 films, though at 72.4% that’s down quite a bit as a percentage. Second place (as ever) was the UK with 52 films, which at 19.9% also represents a drop in percentage. In third place for a second year was Japan. Last year it more than doubled its previous best, and this year it’s done it again, going from 14 to 30 (11.5%). Close behind was France on 25 (9.6%). After that there’s a drop to Canada on 12 (4.6%), and tied for sixth place are China and Italy with 10 (3.8%) apiece.
Normally I’d run down the rest of the countries with multiple films, but there were quite a few this year. The likes of Germany (seven) and Australia, Hong Kong, and New Zealand (five each) contributed about as many as normal, but there were uncommonly strong showings for Sweden (six), South Korea (five), and Spain (also five). In all, 29 countries were involved in the production of at least one film.

A total of 208 directors plus 17 directing partnerships appear on 2018’s main list. The former is a record, smashing the previous best of 157. The latter… isn’t. It is a tie, though. Of those 225 directing ‘units’ (I mean, what do you call them?), 29 had multiple credits, which is also a new record. Top of the pile are Giuliano Carnimeo and Sylvester Stallone, each with four — the former all Sartana films, the latter all Rocky films. Right behind them with three apiece are Kazuo Ikehiro (all Zatoichi films), Frank Oz, Ridley Scott, and Kimiyoshi Yasuda (also all Zatoichi films). A preponderance of sequels also bulk up the list of directors with two films to their name, though I won’t list the series they each contributed to. The directors, however, are: John G. Avildsen, J.A. Bayona, Ingmar Bergman, the Coen brothers, Ryan Coogler, Jon Favreau, Richard Fleischer, Spike Jonze, Richard Lester, Doug Liman, Akira Kurosawa, Christopher McQuarrie, Kenji Misumi, Hayao Miyazaki, Roger Nygard, Todd Phillips, Peyton Reed, Martin Scorsese, Hiroyuki Seshita & Kôbun Shizuno, Steven Soderbergh, Steven Spielberg, and Edward Zwick. Finally, Alan Crosland directed a feature and a short.
For the past few years I’ve specifically charted the number of female directors whose work I’ve watched. There were 9 female directors represented in 2018’s viewing, with 8½ films to their name — the half coming from Marjane Satrapi co-directing Persepolis. As the graph below shows, it’s a pathetically small number, representing just 3.26% of my viewing. It’s an increase on the last two years, at least, but not much of one! I could undoubtedly do better if I sought out more films by female directors, but that’s kind of my point: I just watch films, and this is what happens — if female directors were better represented in the industry as a whole, the graph would automatically look healthier.

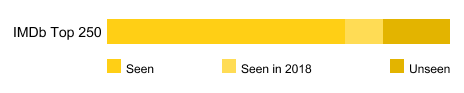
On a somewhat brighter note, at time of writing a stonking 27 films from 2018’s list appear on the IMDb Top 250 (or whatever they want to call it nowadays). That’s my best total ever. However, because the list is ever-changing, the number I have left to see has only gone down by 20, to 49. I’m getting relatively close to the end now, though… The current positions of this year’s inclusions range throughout most of the list, from 29th (Spider-Man: Into the Spider-Verse) to 241st (Paper Moon).
At the end of my annual “top ten” post I always include a list of 50 notable films I missed from that year’s releases, and I continue to track my progress at watching those ‘misses’. In 2018 I watched more movies from every year’s list. To rattle through them (including the overall total seen in brackets), this year I watched: two from 2007 (36); five from 2008 (29); two from 2009 (31); three from 2010 (33); five from 2011 (38); two from 2012 (34); two from 2013 (34); one from 2014 (42); one from 2015 (33); and 12 from 2016 (42).
Finally, in the first year of watching 2017’s 50, I saw 33 of them. For the fourth year in a row, that sets a new record for the best ‘first year’ ever, beating the 30 from 2016’s list that I watched during 2017. This year has also set a record for how many films I watched across all the lists: it adds up to 68, which tops the 60 I saw during 2016.
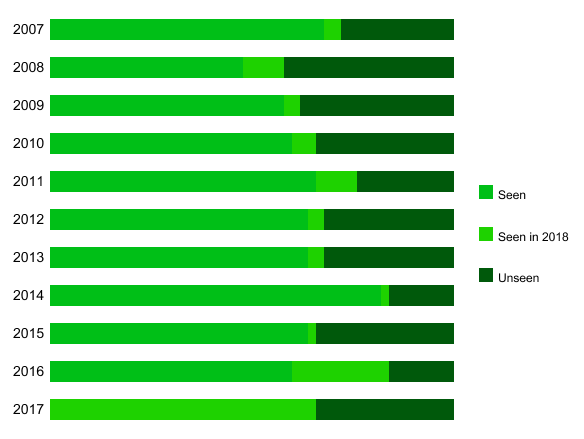
In total, I’ve now seen 385 out of 550 of those ‘missed’ movies. That’s exactly 70%, up from the 63.4% I was at by the end of last year. Shiny. Though, how long this can keep improving is debatable — a couple of those lists are getting fairly near completion, and most of them include some titles I’m not at all interested in watching. Time will tell. (As usual, the 50 for 2018 will be listed in my next post.)
To finish off 2018’s statistics, then, it’s the climax of every review: the scores.
At the top end of the spectrum, this year I awarded 39 five-star ratings. Despite the record-breaking total, that’s not the most I’ve ever handed out (there were 40 in 2015). Did I watch less-good films? Am I stricter? Who can say? Well, it means I gave 14.9% of films full marks, which is roundabouts in my usual range (the lowest year was 11.9%, the highest 21.2%).
Second place went, as usual, to four-star films, of which there were 122 — the most ever. Again, turning it into a percentage makes things more normal: at 46.7% it places bang in the middle of previous years (five have higher percentages, six lower, with a range from 31.5% to 53.3%). The total of 76 three-star films is also the largest number ever, but at 29.1% isn’t close to being the biggest proportionally (that’d be 2012, when three-star films made up 38% of my viewing. It was the only year with more three-star films than four-star ones).
Bringing up the rear, there were 21 two-star films — again, that’s the most ever, but at 8% it’s actually the third smallest proportion-wise. Finally, there were just three one-star films, which sits in that category’s regular ballpark as both a number and a percentage. I don’t know what this all tells us, if anything. Possibly just that I’m a consistent marker. I guess this graph backs that up (barring the weird spike in 2012).
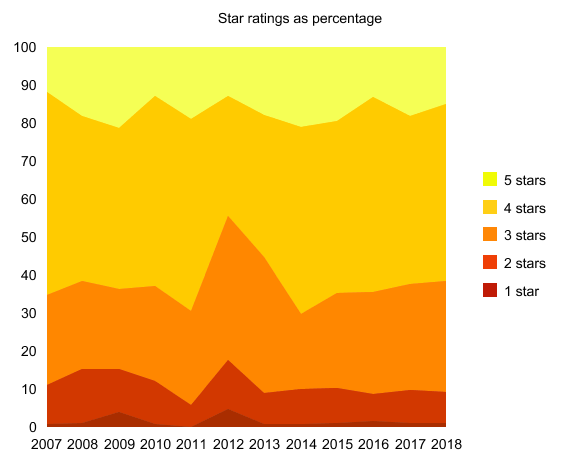
Lastly, all those numbers lead us to the average score; the single figure that (arguably) asserts 2018’s quality compared to other years. The short version is 3.7 out of 5, the same as it’s been for the last three years, and 2007 and 2009 before that too — that’s exactly half of all this blog’s years. But if we go to three decimal places, we can actually rank the years. At that level, 2018 scores 3.663, which is the lowest average for five years. That said, it’s still higher than 2007-2010 and 2012-2013, which means it sits more or less in the middle of all years — 6th out of 12.

As I was saying: pretty consistent marking. (Goodness knows what exactly went on in 2011 and ’12, mind.)
And that’s all the stats done for another year!

2018 is almost at an end! All that’s left is to rank my favourites in my “top 10%” list. But, having watched so many films this year, that 10% is notably bigger than usual — the list might take a little while to put together…

Pingback: 2021 Statistics | 100Films.co.uk